TRENDS ANALYSIS & TIME INTELLIGENCE DASHBOARD
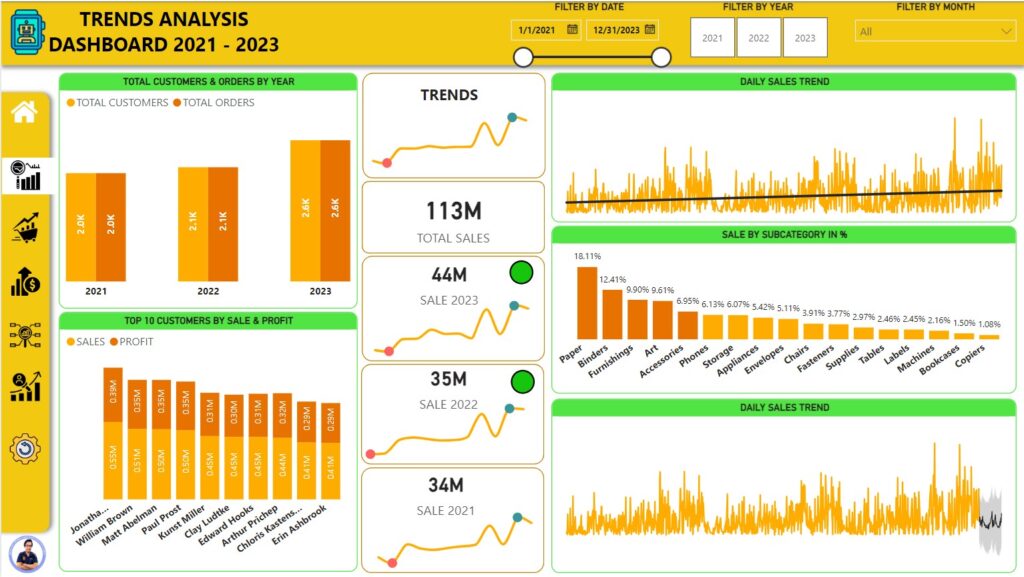
“Trends Analysis Dashboard” focusing on sales performance from 2021 to 2023.
 Key Features:
- Overview: Displays prominent metrics like Total Customers, Total Orders, Total Profit, Cash Flow, and KPIs and Total Sales for each year (2021, 2022, 2023).
- Trend Analysis: Includes line charts for “Daily Sales Trend” and “Total Customers & Orders by Year,” “Profit” and “Sales & Profit by Year” showing sales, profit and customer trends over the three-year period.
- Sales Breakdown: Presents “Sale by Subcategory in %” as a bar chart, providing a breakdown of sales across different product categories.
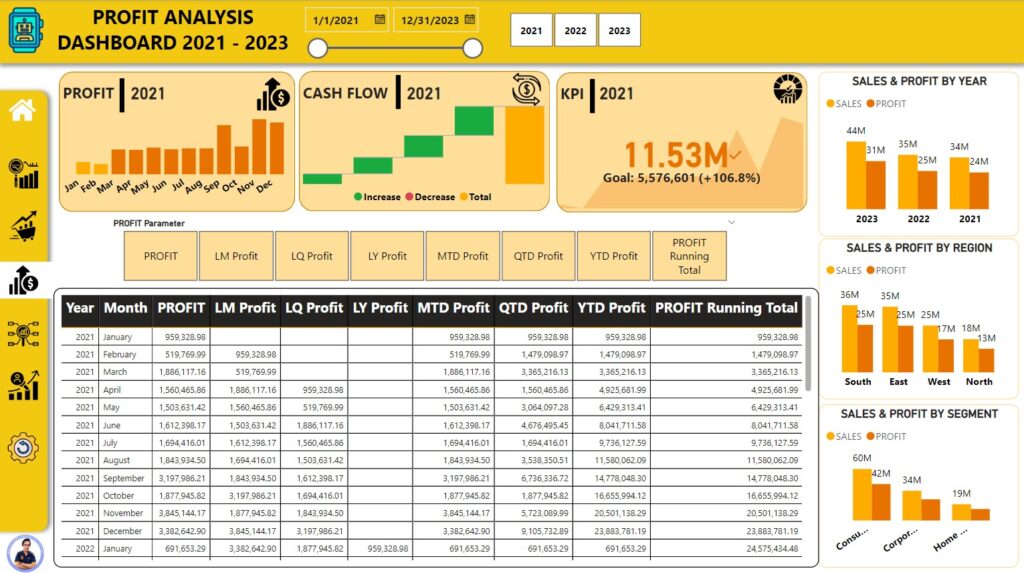
- Profit Breakdown: Presents “Sales & Profit by Region” and “Sales & Profit by Segment” as bar charts, providing a breakdown of sales and profit across different regions and market segments.
- Profitability Metrics: Includes a table with various profit parameters like LM Profit (Last Month), LQ Profit (Last Quarter), LY Profit (Last Year), MTD Profit (Month-to-Date), QTD Profit (Quarter-to-Date), YTD Profit (Year-to-Date), and Profit Running Total.
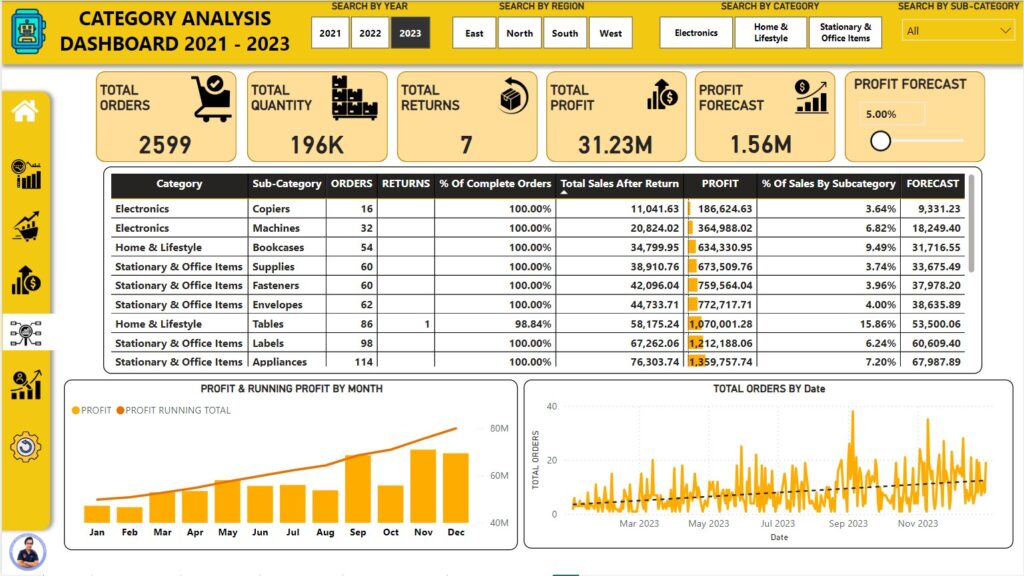
- Category Analysis: Includes a table breaking down sales data by Category and Sub-Category, showing metrics like Orders, Returns, % of Complete Orders, Total Sales After Return, Profit, and % of Sales by Subcategory.
- Profit & Running Profit: Presents a line chart showing “Profit & Running Profit by Month,” illustrating the trend of profit accumulation over time.
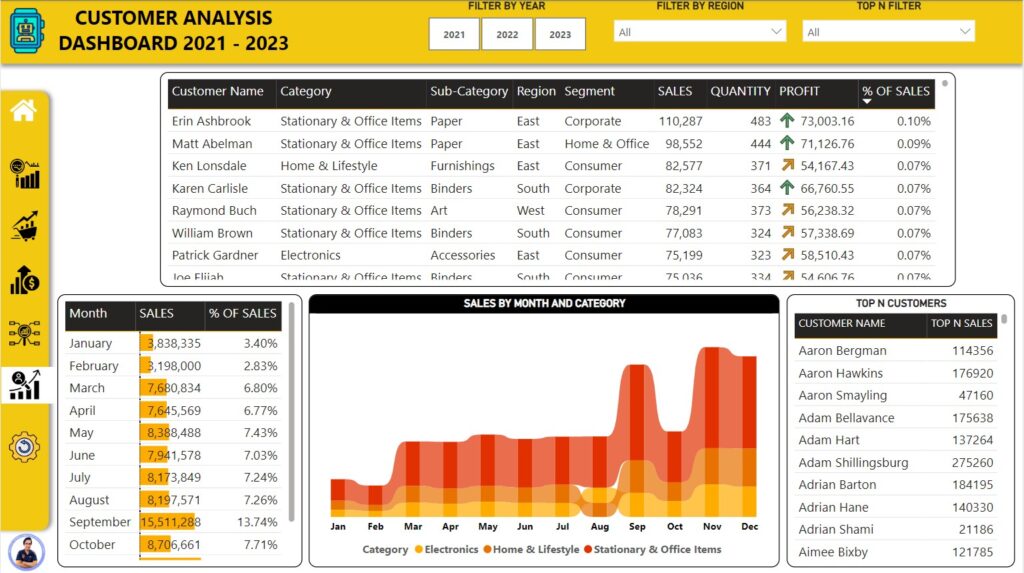
- Customer Details: Displays a table with detailed customer information including Customer Name, Category, Sub-Category, Region, Segment, Sales, Quantity, Profit, and % of Sales.
- Sales Trends: Includes a bar chart showing “Sales by Month” with the percentage of sales for each month.
- Top Customers: Presents a list of “Top N Customers” by sales volume.
- Filters: Allows for dynamic data filtering by year, region, and top N customers.
- Filters: Allows for dynamic data filtering by date (year, month, and date range).
- Modern Design: Utilizes a dark color scheme with contrasting elements for visual appeal.
 Insights Gained:
- Sales Growth: The line charts and total sales figures provide insights into the overall sales growth trend from 2021 to 2023.
- Customer Behavior: The “Total Customers & Orders by Year” chart reveals changes in customer base and order frequency over time.
- Product Performance: The “Sale by Subcategory in %” chart highlights the best-selling product categories, enabling informed product strategy.
- Key Customers: The “Top 10 Customers” section identifies high-value customers for targeted sales and marketing efforts.
- Profit Growth: The bar charts and total profit figures provide insights into the overall profit growth trend from 2021 to 2023.
- Regional Performance: The “Sales & Profit by Region” chart highlights the performance of different regions in terms of sales and profit generation.
- Segment Analysis: The “Sales & Profit by Segment” chart reveals the profitability of different market segments.
- Profitability Trends: The table with profit parameters allows for in-depth analysis of profit trends over different time periods.
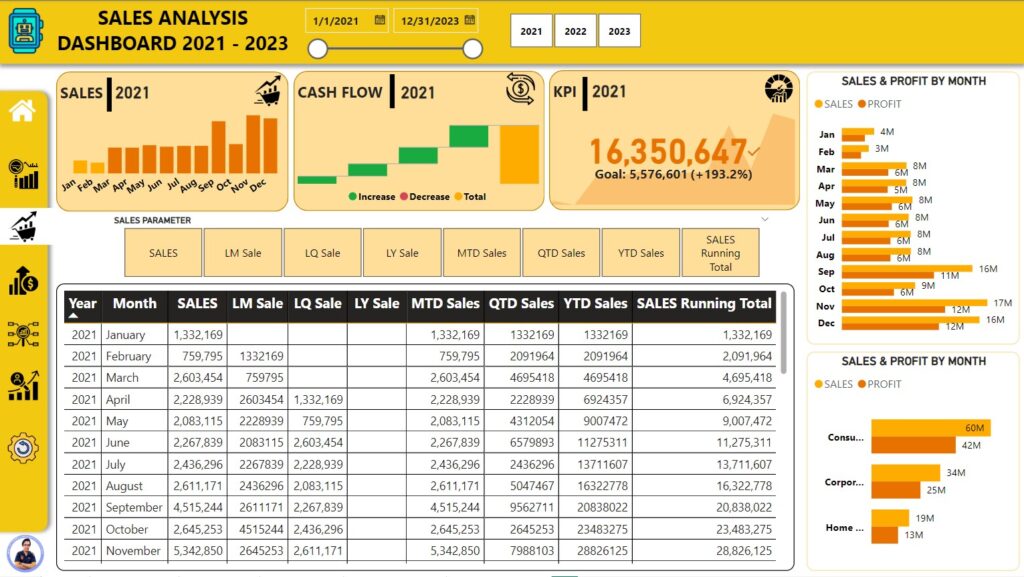
- Sales Performance: The dashboard provides an overview of sales performance across different categories, including total orders, quantity, returns, and profit.
- Category Performance: The table allows for detailed analysis of individual categories and sub-categories, highlighting their contribution to overall sales and profitability.
- Profit Trends: The “Profit & Running Profit by Month” chart reveals the trend of profit accumulation over time, identifying periods of high and low profitability.
- Category Profitability: The “% of Sales by Subcategory” column helps identify the most profitable product categories.
- Customer Segmentation: The table provides insights into customer demographics and purchasing behavior, including category preferences, region, and segment.
- Sales Trends: The “Sales by Month” chart reveals seasonal trends and fluctuations in sales volume throughout the year.
- Top Customers: The “Top N Customers” section identifies high-value customers for targeted sales and marketing efforts.
- Customer Profitability: The “Profit” column helps identify profitable customers and those with higher contribution margins.
 Potential Enhancements:
- Interactive Elements: Incorporating interactive elements like tooltips or hover effects to display detailed information upon mouseover.
- Additional Metrics: Including metrics like customer lifetime value, average order value, and profit margins would provide deeper insights.
- KPIs: Defining and displaying more specific KPIs, such as profit margin, return on investment (ROI), and customer lifetime value.
- KPIs: Defining and displaying key performance indicators (KPIs) such as customer lifetime value, customer churn rate, and customer acquisition cost.
- Customer Lifetime Value (CLTV) Analysis: Calculating and visualizing CLTV to identify high-value customers and prioritize retention efforts.
- Goal Setting: Including a feature to set and track profit goals for different periods.
- Forecasting: Enhancing the profit forecast with more sophisticated models and incorporating uncertainty estimates.
- Segmentation: Adding filters for customer segments, product categories, or sales channels would allow for more granular analysis.
Overall:
This dashboard offers a valuable overview of customer data and sales performance. By visualizing key metrics and trends, it can help businesses make informed decisions about customer acquisition, retention, and targeted marketing campaigns.
