")
KASHEF
UDDIN
TRENDS ANALYSIS & TIME INTELLIGENCE DASHBOARD
“Trends Analysis Dashboard” focusing on sales performance from 2021 to 2023.
Key Features:
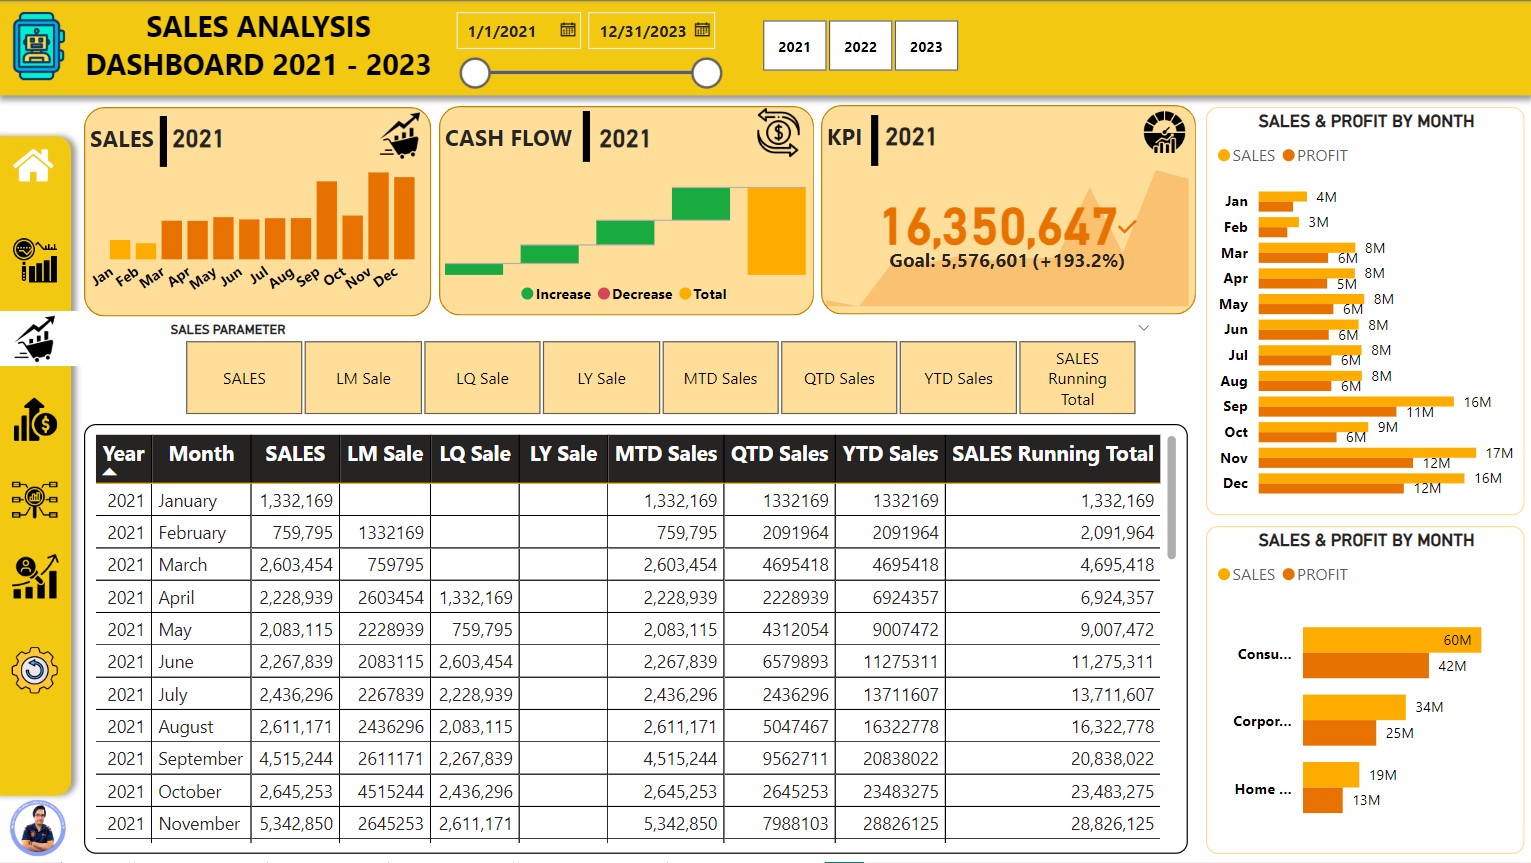
- Overview: Displays prominent metrics like Total Customers, Total Orders, Total Profit, Cash Flow, and KPIs and Total Sales for each year (2021, 2022, 2023).
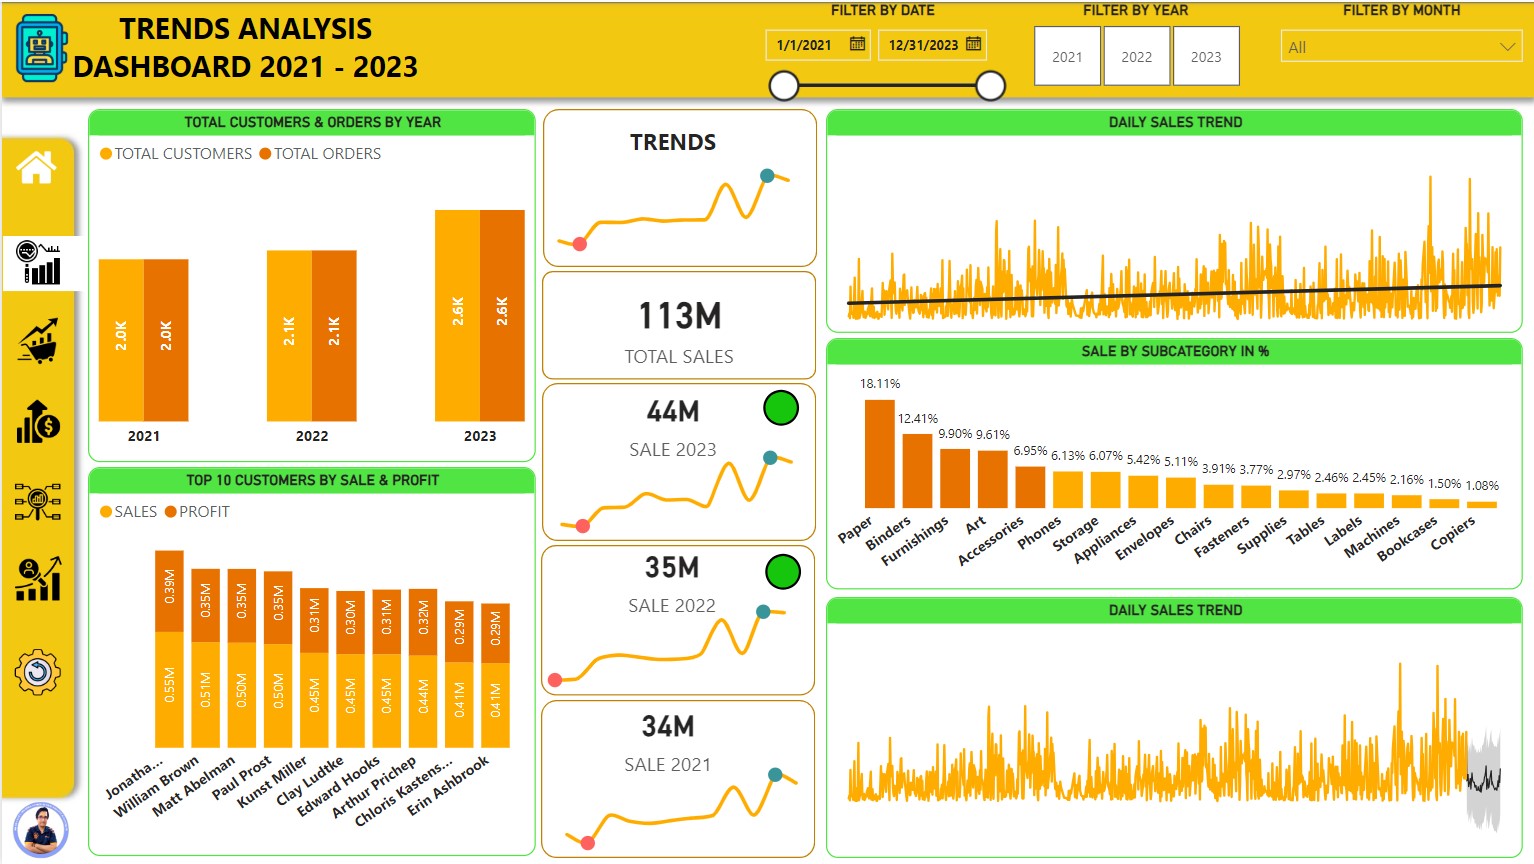
- Trend Analysis: Includes line charts for “Daily Sales Trend” and “Total Customers & Orders by Year,” “Profit” and “Sales & Profit by Year” showing sales.
- Sales Breakdown: Presents “Sale by Subcategory in %” as a bar chart, providing a breakdown of sales across different product categories.
- Profit Breakdown: Presents “Sales & Profit by Region” and “Sales & Profit by Segment” as bar charts, providing a breakdown of sales and profit.
- Profitability Metrics: Includes a table with various profit parameters like LM Profit (Last Month), LQ Profit (Last Quarter), LY Profit (Last Year).
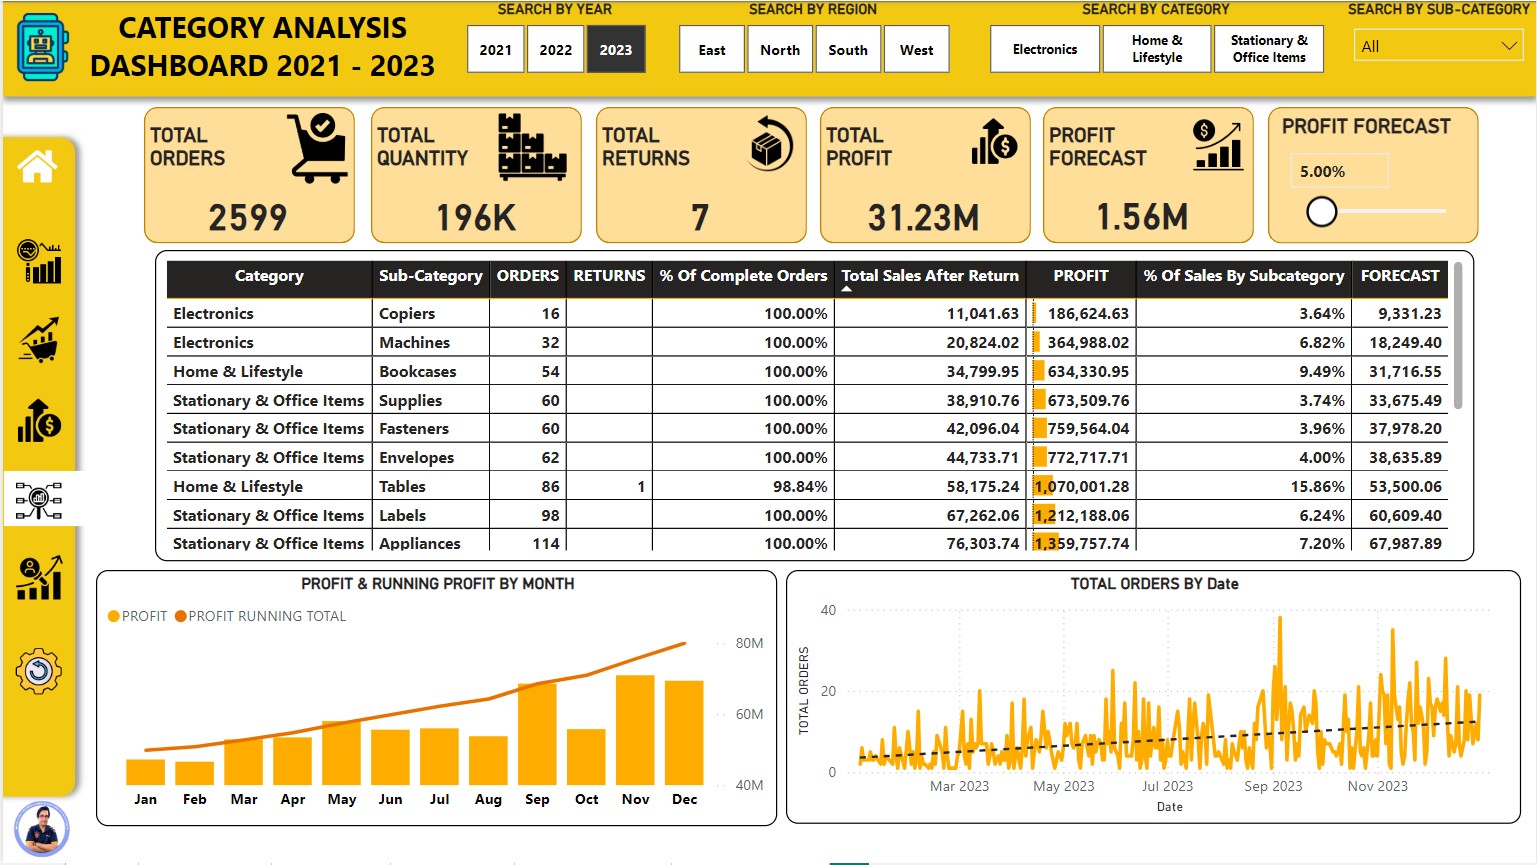
- Category Analysis: Includes a table breaking down sales data by Category and Sub-Category, showing metrics like Orders, Returns, % of Complete Orders.
- Profit & Running Profit: Presents a line chart showing “Profit & Running Profit by Month,” illustrating the trend of profit accumulation over time.
- Sales Trends: Includes a bar chart showing “Sales by Month” with the percentage of sales for each month.
- Customer Details: Displays a table with detailed customer information including Customer Name, Category, Sub-Category, Region, Sales, Quantity, and Profit.
- Top Customers: Presents a list of “Top N Customers” by sales volume.
- Filters: Allows for dynamic data filtering by year, region, and top N customers.
- Filters: Allows for dynamic data filtering by date (year, month, and date range).
- Modern Design: Utilizes a dark color scheme with contrasting elements for visual appeal.
Insights Gained:
- Sales Growth: The line charts and total sales figures provide insights into the overall sales growth trend from 2021 to 2023.
- Customer Behavior: The “Total Customers & Orders by Year” chart reveals changes in customer base and order frequency over time.
- Product Performance: The “Sale by Subcategory in %” chart highlights the best-selling product categories, enabling informed product strategy.
- Key Customers: The “Top 10 Customers” section identifies high-value customers for targeted sales and marketing efforts.
- Profit Growth: The bar charts and total profit figures provide insights into the overall profit growth trend from 2021 to 2023.
- Regional Performance: The “Sales & Profit by Region” chart highlights the performance of different regions in terms of sales and profit generation.
- Segment Analysis: The “Sales & Profit by Segment” chart reveals the profitability of different market segments.
- Profitability Trends: The table with profit parameters allows for in-depth analysis of profit trends over different time periods.
- Sales Performance: The dashboard provides an overview of sales performance across different categories, including total orders, quantity, returns, and profit.
- Category Performance: The table allows for detailed analysis of individual categories and sub-categories, highlighting their contribution to overall sales and profitability.
- Profit Trends: The “Profit & Running Profit by Month” chart reveals the trend of profit accumulation over time, identifying periods of high and low profitability.
- Category Profitability: The “% of Sales by Subcategory” column helps identify the most profitable product categories.
- Customer Segmentation: The table provides insights into customer demographics and purchasing behavior, including category preferences, region, and segment.
- Sales Trends: The “Sales by Month” chart reveals seasonal trends and fluctuations in sales volume throughout the year.
- Top Customers: The “Top N Customers” section identifies high-value customers for targeted sales and marketing efforts.
- Customer Profitability: The “Profit” column helps identify profitable customers and those with higher contribution margins.
Potential Enhancements:
- Interactive Elements: Incorporating interactive elements like tooltips or hover effects to display detailed information upon mouseover.
- Additional Metrics: Including metrics like customer lifetime value, average order value, and profit margins would provide deeper insights.
- KPIs: Defining and displaying more specific KPIs, such as profit margin, return on investment (ROI), and customer lifetime value.
- KPIs: Defining and displaying key performance indicators (KPIs) such as customer lifetime value, customer churn rate, and customer acquisition cost.
- Customer Lifetime Value (CLTV) Analysis: Calculating and visualizing CLTV to identify high-value customers and prioritize retention efforts.
- Goal Setting: Including a feature to set and track profit goals for different periods.
- Forecasting: Enhancing the profit forecast with more sophisticated models and incorporating uncertainty estimates.
- Segmentation: Adding filters for customer segments, product categories, or sales channels would allow for more granular analysis.
Overall:
This dashboard offers a valuable overview of customer data and sales performance. By visualizing key metrics and trends, it can help businesses make informed decisions about customer acquisition, retention, and targeted marketing campaigns.
TRENDS ANALYSIS & TIME INTELLIGENCE DASHBOARD
“Trends Analysis Dashboard” focusing on sales performance from 2021 to 2023.
Key Features:
- Overview: Displays prominent metrics like Total Customers, Total Orders, Total Profit, Cash Flow, and KPIs and Total Sales for each year (2021, 2022, 2023).
- Trend Analysis: Includes line charts for “Daily Sales Trend” and “Total Customers & Orders by Year,” “Profit” and “Sales & Profit by Year” showing sales.
- Sales Breakdown: Presents “Sale by Subcategory in %” as a bar chart, providing a breakdown of sales across different product categories.
- Profit Breakdown: Presents “Sales & Profit by Region” and “Sales & Profit by Segment” as bar charts, providing a breakdown of sales and profit.
- Profitability Metrics: Includes a table with various profit parameters like LM Profit (Last Month), LQ Profit (Last Quarter), LY Profit (Last Year).
- Category Analysis: Includes a table breaking down sales data by Category and Sub-Category, showing metrics like Orders, Returns, % of Complete Orders.
- Profit & Running Profit: Presents a line chart showing “Profit & Running Profit by Month,” illustrating the trend of profit accumulation over time.
- Sales Trends: Includes a bar chart showing “Sales by Month” with the percentage of sales for each month.
- Customer Details: Displays a table with detailed customer information including Customer Name, Category, Sub-Category, Region, Sales, Quantity, and Profit.
- Top Customers: Presents a list of “Top N Customers” by sales volume.
- Filters: Allows for dynamic data filtering by year, region, and top N customers.
- Filters: Allows for dynamic data filtering by date (year, month, and date range).
- Modern Design: Utilizes a dark color scheme with contrasting elements for visual appeal.
Insights Gained:
- Sales Growth: The line charts and total sales figures provide insights into the overall sales growth trend from 2021 to 2023.
- Customer Behavior: The “Total Customers & Orders by Year” chart reveals changes in customer base and order frequency over time.
- Product Performance: The “Sale by Subcategory in %” chart highlights the best-selling product categories, enabling informed product strategy.
- Key Customers: The “Top 10 Customers” section identifies high-value customers for targeted sales and marketing efforts.
- Profit Growth: The bar charts and total profit figures provide insights into the overall profit growth trend from 2021 to 2023.
- Regional Performance: The “Sales & Profit by Region” chart highlights the performance of different regions in terms of sales and profit generation.
- Segment Analysis: The “Sales & Profit by Segment” chart reveals the profitability of different market segments.
- Profitability Trends: The table with profit parameters allows for in-depth analysis of profit trends over different time periods.
- Sales Performance: The dashboard provides an overview of sales performance across different categories, including total orders, quantity, returns, and profit.
- Category Performance: The table allows for detailed analysis of individual categories and sub-categories, highlighting their contribution to overall sales and profitability.
- Profit Trends: The “Profit & Running Profit by Month” chart reveals the trend of profit accumulation over time, identifying periods of high and low profitability.
- Category Profitability: The “% of Sales by Subcategory” column helps identify the most profitable product categories.
- Customer Segmentation: The table provides insights into customer demographics and purchasing behavior, including category preferences, region, and segment.
- Sales Trends: The “Sales by Month” chart reveals seasonal trends and fluctuations in sales volume throughout the year.
- Top Customers: The “Top N Customers” section identifies high-value customers for targeted sales and marketing efforts.
- Customer Profitability: The “Profit” column helps identify profitable customers and those with higher contribution margins.
Potential Enhancements:
- Interactive Elements: Incorporating interactive elements like tooltips or hover effects to display detailed information upon mouseover.
- Additional Metrics: Including metrics like customer lifetime value, average order value, and profit margins would provide deeper insights.
- KPIs: Defining and displaying more specific KPIs, such as profit margin, return on investment (ROI), and customer lifetime value.
- KPIs: Defining and displaying key performance indicators (KPIs) such as customer lifetime value, customer churn rate, and customer acquisition cost.
- Customer Lifetime Value (CLTV) Analysis: Calculating and visualizing CLTV to identify high-value customers and prioritize retention efforts.
- Goal Setting: Including a feature to set and track profit goals for different periods.
- Forecasting: Enhancing the profit forecast with more sophisticated models and incorporating uncertainty estimates.
- Segmentation: Adding filters for customer segments, product categories, or sales channels would allow for more granular analysis.
Overall:
This dashboard offers a valuable overview of customer data and sales performance. By visualizing key metrics and trends, it can help businesses make informed decisions about customer acquisition, retention, and targeted marketing campaigns.