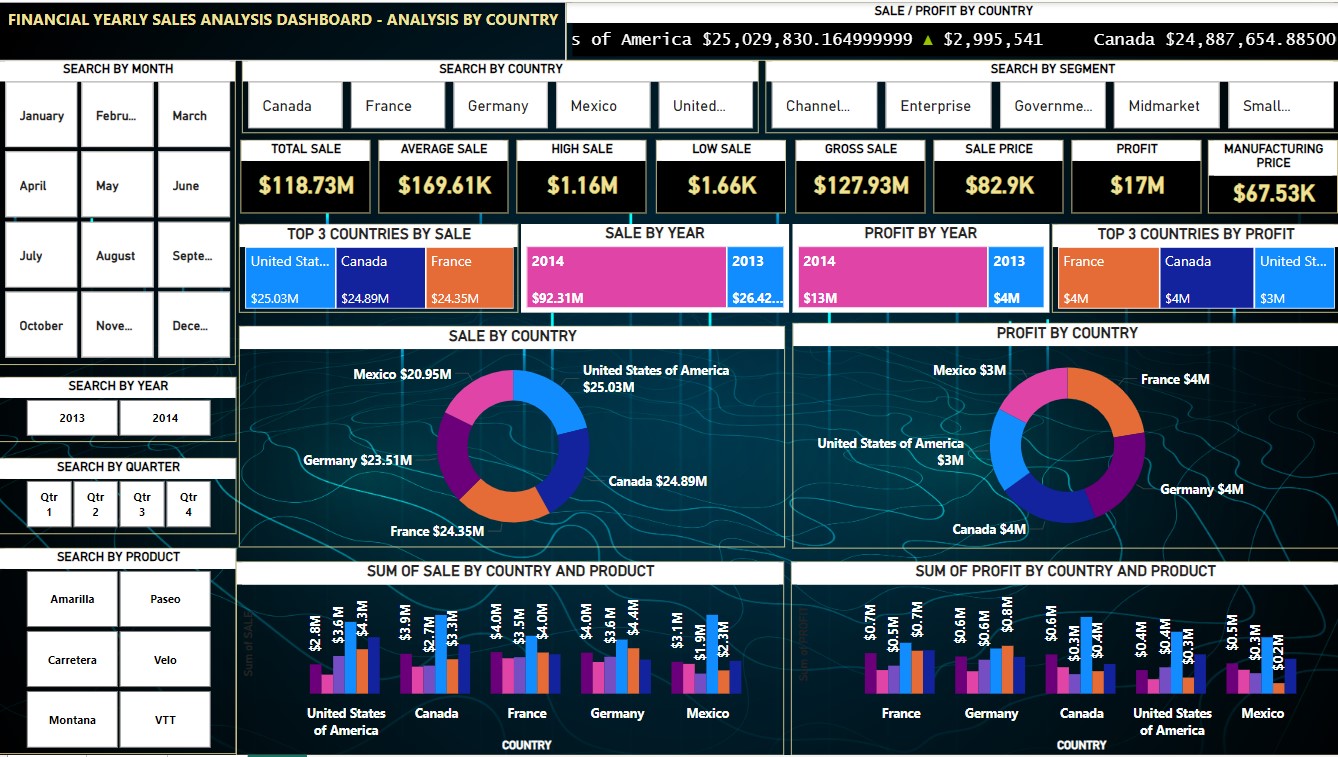
The Financial Yearly Sales Analysis Dashboard focused on analyzing sales data by Country. Here are the key sections and data points presented in the dashboard:
Filters:
Search by Month, Year, Quarter, Product, Country, & Search by Segment like Enterprise, Government, Midmarket, Small Business
Key Metrics:
Total Sale, Average Sale, High Sale, Low Sale, Gross Sale, Sale Price, Profit & Manufacturing Price.
Top 3 Countries by Sale:
Top 3 Countries by Sale
Sale by Year:
2014: $92.31M
2013: $26.42M
Profit by Year:
2014: $13M
2013: $4M
Top 3 Countries by Profit:
Top 3 Countries by Profit.
Sale by Country (Donut Chart):
Total Sale by Country.
Profit by Country (Donut Chart):
Total Profit by Country.
Sum of Sale by Country and Product (Bar Chart):
Displays sales data broken down by products for each country.
Sum of Profit by Country and Product (Bar Chart):
Displays profit data broken down by products for each country.
This dashboard provides a comprehensive view of sales and profit data by country, year, product, and business segment. The visualizations help to quickly identify top-performing countries and products, as well as track sales and profit trends over the selected years.
KASHEF UDDIN
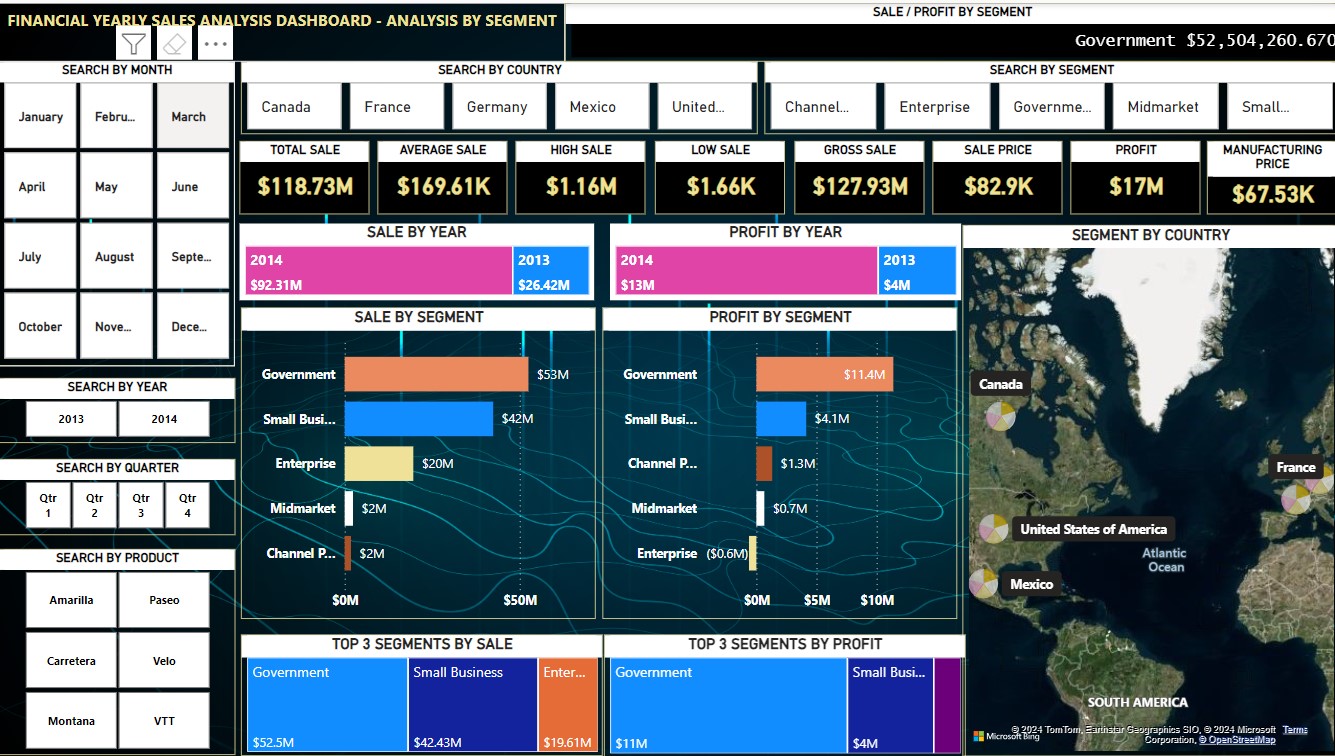
FINANCIAL ANALYSIS DASHBOARD BY COUNTRY
The Financial Yearly Sales Analysis Dashboard focused on analyzing sales data by Country. Here are the key sections and data points presented in the dashboard:
Filters:
Search by Month, Year, Quarter, Product, Country, & Search by Segment like Enterprise, Government, Midmarket, Small Business
Key Metrics:
Total Sale, Average Sale, High Sale, Low Sale, Gross Sale, Sale Price, Profit & Manufacturing Price.
Top 3 Countries by Sale:
Top 3 Countries by Sale
Sale by Year:
2014: $92.31M
2013: $26.42M
Profit by Year:
2014: $13M
2013: $4M
Top 3 Countries by Profit:
Top 3 Countries by Profit.
Sale by Country: (Donut Chart)
Total Sale by Country.
Profit by Country: (Donut Chart)
Total Profit by Country.
Sum of Sale by Country and Product: (Bar Chart)
Displays sales data broken down by products for each country.
Sum of Profit by Country and Product: (Bar Chart)
Displays profit data broken down by products for each country.
This dashboard provides a comprehensive view of sales and profit data by country, year, product, and business segment. The visualizations help to quickly identify top-performing countries and products, as well as track sales and profit trends over the selected years.
")