CRYPTO CURRENCY HISTORICAL PRICE ANALYSIS DASHBOARD
The Cryptocurrency Historical Price Analysis Dashboard provides an in-depth analysis of market data with forecasting capabilities. Here’s a detailed description of the dashboard:
Filter Options (Left Panel):
- Slice by Currency Name: Users can filter the data by selecting different cryptocurrencies such as Aave, Bitcoin, Ethereum, Litecoin, XRP, and many others.
Filter Options (Top Panel):
- Slice by Year: Users can filter the data by selecting specific years from 2013 to 2021.
- Slice by Month: Users can filter the data by selecting specific months from January to December.
Summary Metrics (Top Center Panel):
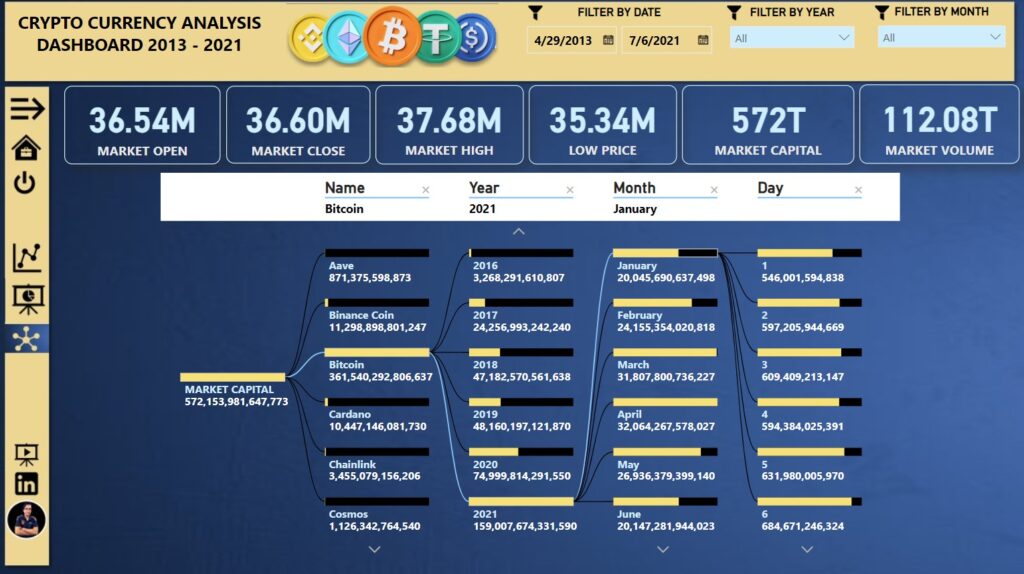
- Market Capital: Displays the total market capitalization.
- Volume: Shows the total trading volume.
- High: The highest price recorded.
- Low: The lowest price recorded.
- Average: The average price.
- Open: The opening price.
- Close: The closing price.
Data Visualization Panels:
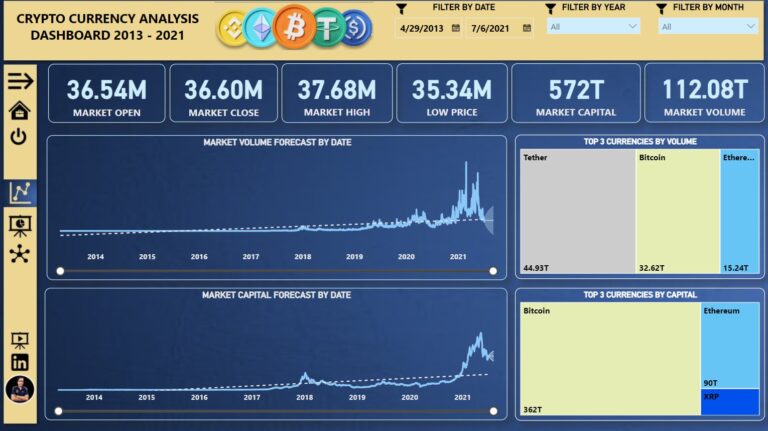
- Market Capital by Date – Forecast (Center Panel): A line chart showing the historical market forecast projection for future market capitalization.
- Volume by Date – Forecast (Right Center Panel): A line chart showing the historical trading volume over time with a forecast projection for future trading volume.
- High & Low by Date (Bottom Left Panel): A line chart showing the historical high and low prices over time.
- Open & Close by Date (Bottom Right Panel): A line chart showing the historical opening and closing prices over time.
This dashboard offers a comprehensive view of the historical price data of various cryptocurrencies, along with forecasting capabilities. Users can analyze trends over different time periods and across different cryptocurrencies, providing valuable insights for decision-making.


KASHEF
UDDIN
CRYPTO CURRENCY HISTORICAL
PRICE ANALYSIS DASHBOARD
The Cryptocurrency Historical Price Analysis Dashboard provides an in-depth analysis of market data with forecasting capabilities. Here’s a detailed description of the dashboard:
Filter Options:
(Left Panel)
- Slice by Currency Name: Users can filter the data by selecting different cryptocurrencies such as Aave, Bitcoin, Ethereum, Litecoin, XRP, and many others.
Filter Options:
(Top Panel)
- Slice by Year: Users can filter the data by selecting specific years from 2013 to 2021.
- Slice by Month: Users can filter the data by selecting specific months from January to December.
Summary Metrics:
(Top Center Panel)
- Market Capital: Displays the total market capitalization.
- Volume: Shows the total trading volume.
- High: The highest price recorded.
- Low: The lowest price recorded.
- Average: The average price.
- Open: The opening price.
- Close: The closing price.
Data Visualization Panels:
- Market Capital by Date – Forecast (Center Panel): A line chart showing the historical market forecast projection for future market capitalization.
- Volume by Date – Forecast (Right Center Panel): A line chart showing the historical trading volume over time with a forecast projection for future trading volume.
- High & Low by Date (Bottom Left Panel): A line chart showing the historical high and low prices over time.
- Open & Close by Date (Bottom Right Panel): A line chart showing the historical opening and closing prices over time.
This dashboard offers a comprehensive view of the historical price data of various cryptocurrencies, along with forecasting capabilities. Users can analyze trends over different time periods and across different cryptocurrencies, providing valuable insights for decision-making.


