CREDIT CARD WEEKLY ANALYSIS REPORT
Credit Card Weekly Analysis Report is a comprehensive overview of the Credit Card Transaction and data. It provides insights into various aspects of credit card usage, including revenue, transaction count, interest earned, card category performance and spending patterns.
Key features and insights:
-
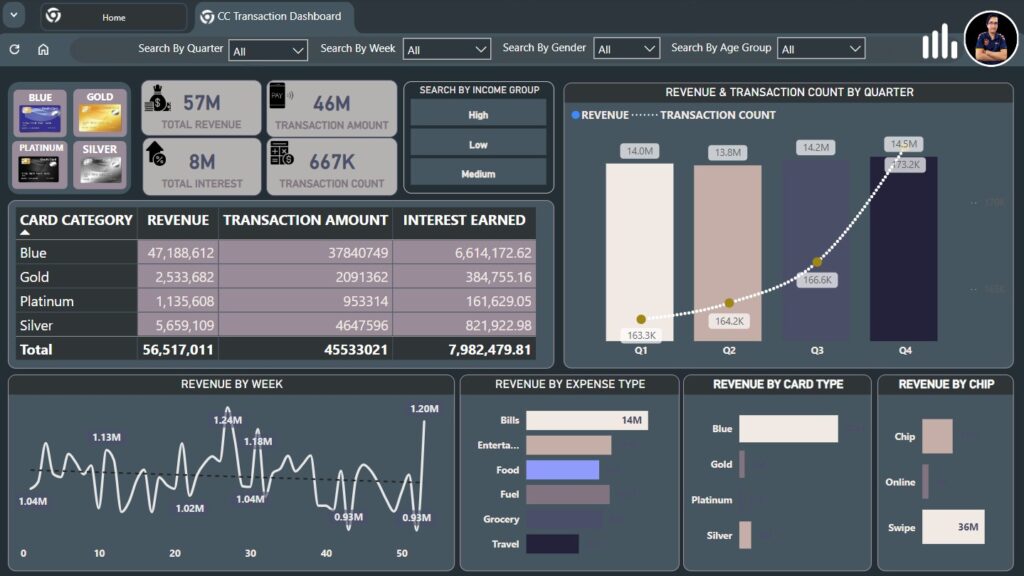
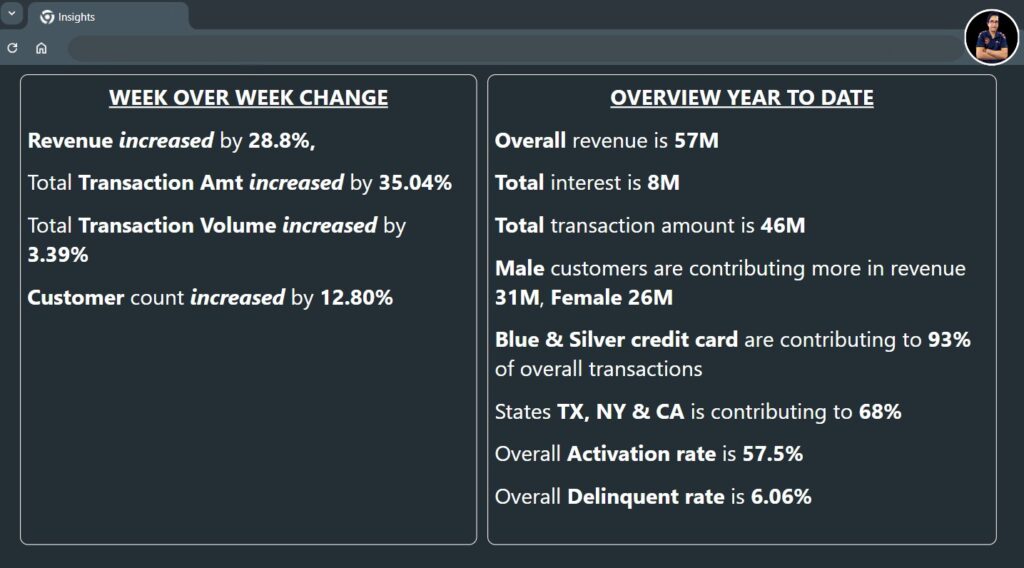
Overview: The dashboard provides a high-level summary of total revenue, transaction amount, and interest earned for the selected time period.
-
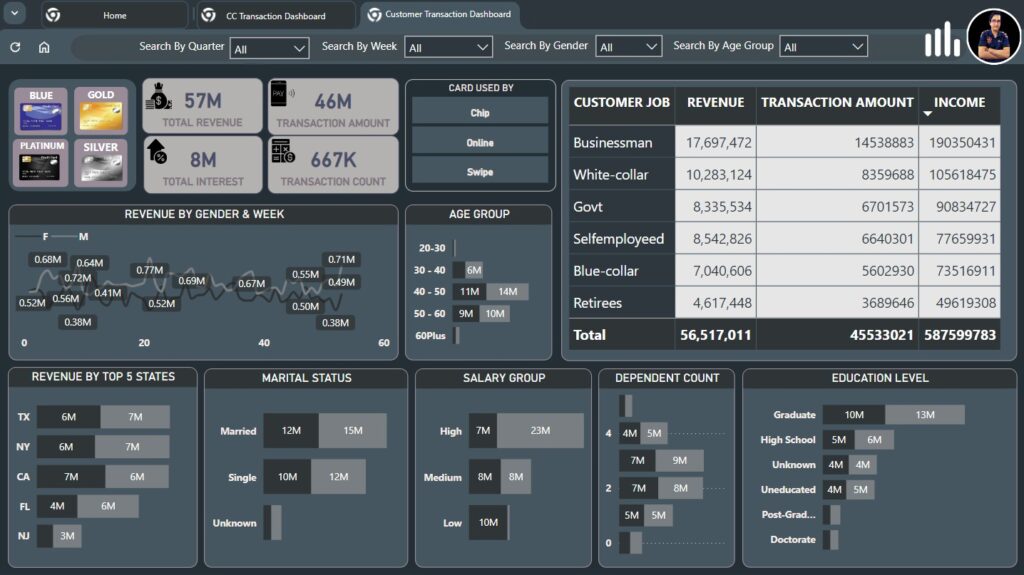
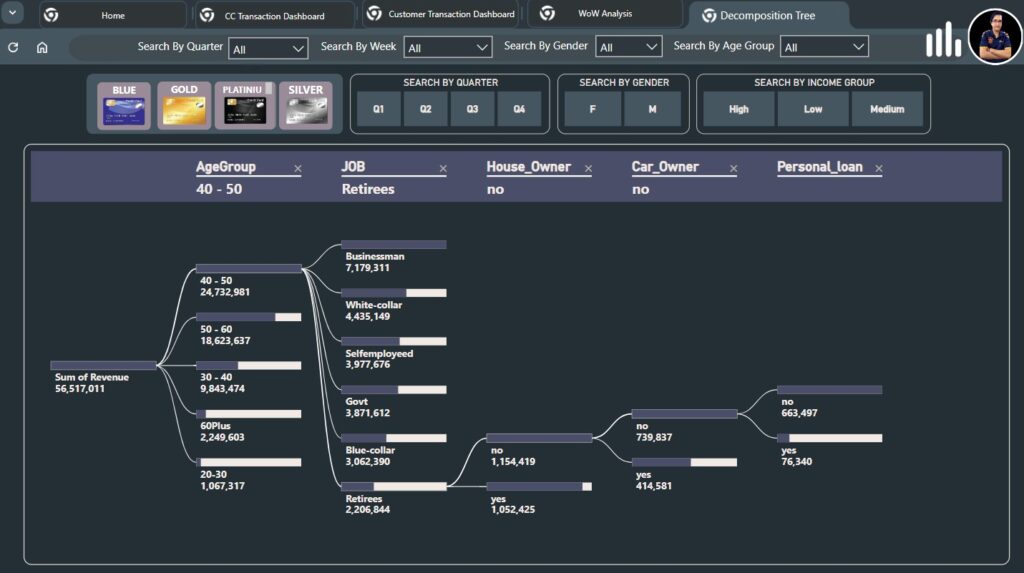
Segmentation: The dashboard allows users to segment data by quarter, week, gender, age group, income group, and card category. This enables users to analyze different customer segments and identify trends.
-
Revenue and Transaction Count by Quarter: A line chart shows the revenue and transaction count for each quarter, allowing users to visualize seasonal trends.
-
Card Category Performance: A table shows the revenue, transaction amount, and interest earned for each card category (Blue, Gold, Platinum, Silver). This information helps to assess the performance of different card types.
-
Revenue by Week: A line chart shows the revenue for each week of the year, providing a detailed view of weekly trends.
-
Revenue by Expense Type: A bar chart shows the revenue generated by different expense types (Bills, Entertainment, Food, Fuel, Grocery, Travel), giving insights into customer spending habits.
-
Revenue by Card Type: A bar chart shows the revenue generated by different card types (Blue, Gold, Platinum, Silver), providing information on card usage preferences.
-
Revenue by Chip: A bar chart shows the revenue generated by different chip types (Chip, Online, Swipe), indicating the popularity of different payment methods.
Overall, the dashboard is a valuable tool for analyzing credit card transaction data and gaining insights into customer behavior. It can be used to identify trends, assess performance, and make data-driven decisions.
