")
KASHEF
UDDIN
BASIC SALES ANALYSIS
DASHBOARD
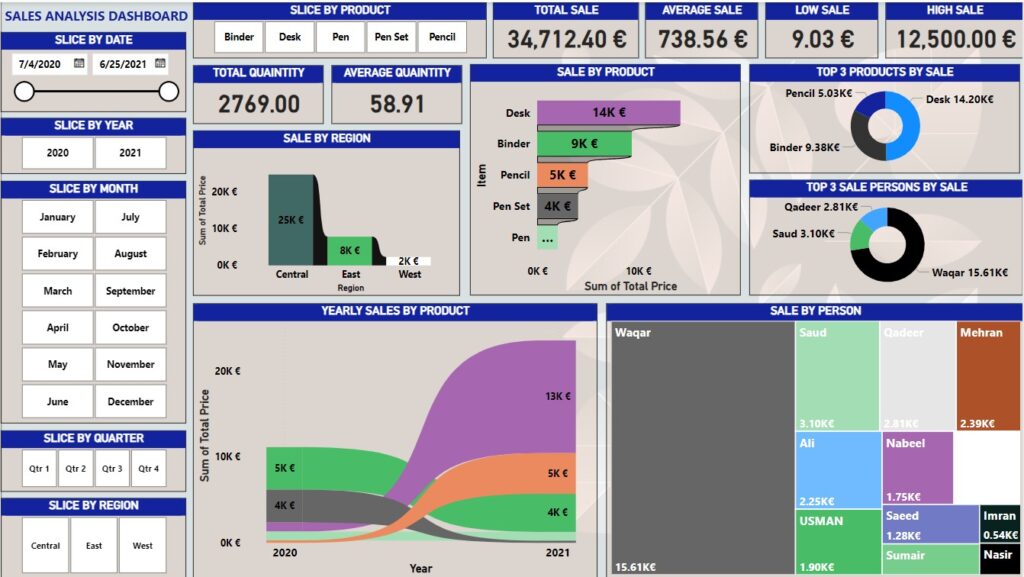
The Sales Analysis Dashboard provides a detailed overview of sales data across various dimensions such as date, product, region, and salesperson. Here’s a comprehensive description of the dashboard:
Filter Options:
(Left Panel)
- Slice by Date: A date range filter allows users to select a specific period for analysis.
- Slice by Year: Allows filtering of data by selecting either the year 2020 or 2021.
- Slice by Month: Provides the option to filter data by each month from January to December.
- Slice by Quarter: Allows filtering data by quarters (Qtr 1, Qtr 2, Qtr 3, Qtr 4).
- Slice by Region: Users can filter sales data by region: Central, East, or West.
Summary Metrics:
(Top Panel)
- Total Quantity: Displays the total quantity of products sold.
- Average Quantity: Shows the average quantity sold.
- Total Sale: The total sales amount.
- Average Sale: Displays the average sales amount per transaction.
- Low Sale: Shows the lowest sales amount recorded.
- High Sale: Indicates the highest sales amount recorded.
Sales Breakdown:
(Right and Center Panels)
- Slice by Product: Allows filtering by different product categories like Binder, Desk, Pen Set, and Pencil.
- Sale by Region: A bar chart showing sales distribution by region, with the Central region leading at €25K, followed by the East region at €82k.
- Top 3 Sales Persons by Sale: A pie chart showing the top three salespersons by sales amount, with Waqar leading at €15.61K, and Qadeer at €2.81K.
Yearly Sales by Product:
(Bottom Center)
- Yearly Sales by Product: An area chart displaying sales by product over the years 2020 and 2021. The chart shows the distribution of sales among various products across the selected years.
This dashboard provides a comprehensive view of sales performance, allowing users to drill down into specific time periods, regions, products, and salespersons. It is designed to help users analyze sales trends, identify top-performing products and salespersons, and make data-driven decisions.
BASIC SALES ANALYSIS DASHBOARD
The Sales Analysis Dashboard provides a detailed overview of sales data across various dimensions such as date, product, region, and salesperson. Here’s a comprehensive description of the dashboard:
Filter Options (Left Panel):
- Slice by Date: A date range filter allows users to select a specific period for analysis.
- Slice by Year: Allows filtering of data by selecting either the year 2020 or 2021.
- Slice by Month: Provides the option to filter data by each month from January to December.
- Slice by Quarter: Allows filtering data by quarters (Qtr 1, Qtr 2, Qtr 3, Qtr 4).
- Slice by Region: Users can filter sales data by region: Central, East, or West.
Summary Metrics (Top Panel):
- Total Quantity: Displays the total quantity of products sold.
- Average Quantity: Shows the average quantity sold.
- Total Sale: The total sales amount.
- Average Sale: Displays the average sales amount per transaction.
- Low Sale: Shows the lowest sales amount recorded.
- High Sale: Indicates the highest sales amount recorded.
Sales Breakdown (Right and Center Panels):
- Slice by Product: Allows filtering by different product categories like Binder, Desk, Pen Set, and Pencil.
- Sale by Region: A bar chart showing sales distribution by region, with the Central region leading at €25K, followed by the East region at €82k.
- Top 3 Sales Persons by Sale: A pie chart showing the top three salespersons by sales amount, with Waqar leading at €15.61K, and Qadeer at €2.81K.
Yearly Sales by Product (Bottom Center):
- Yearly Sales by Product: An area chart displaying sales by product over the years 2020 and 2021. The chart shows the distribution of sales among various products across the selected years.
This dashboard provides a comprehensive view of sales performance, allowing users to drill down into specific time periods, regions, products, and salespersons. It is designed to help users analyze sales trends, identify top-performing products and salespersons, and make data-driven decisions.